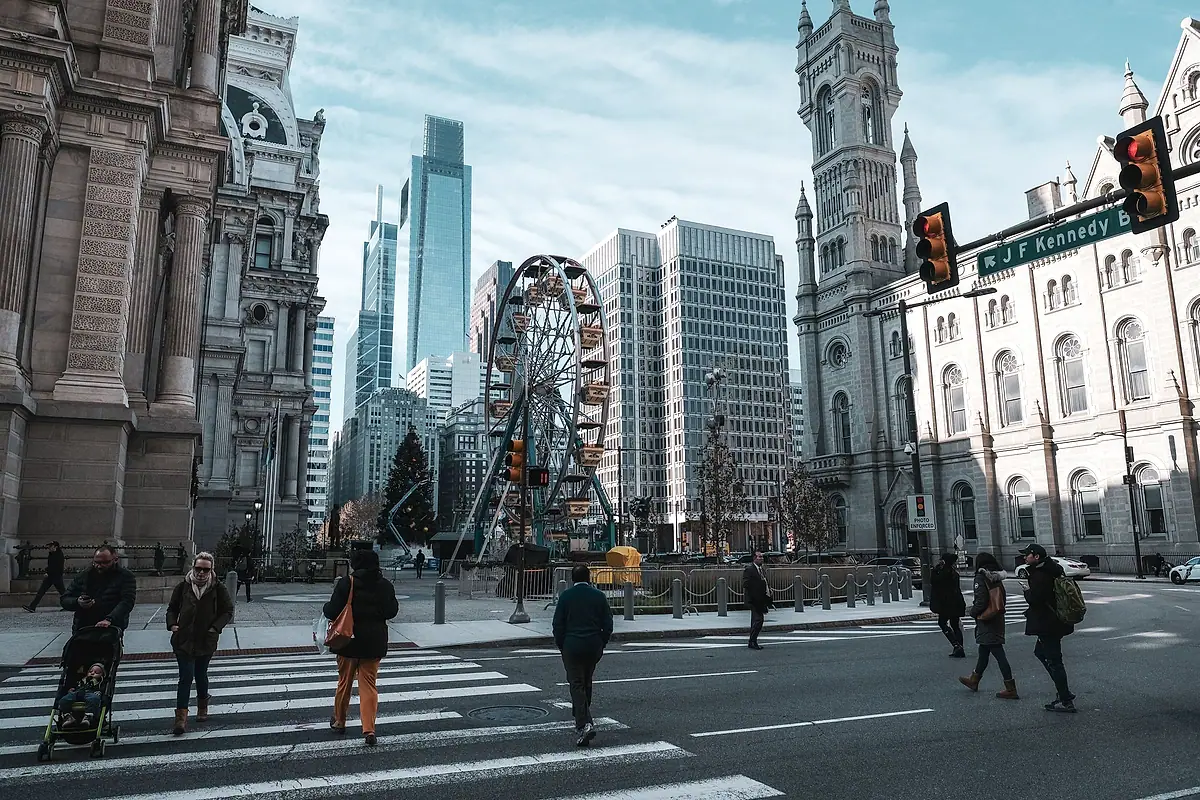
Pedestrians, Cyclists and the Shape of the Road
People walking and cycling have no crash structure, so the margin for error has to come from the road. How speed, width and light shape their odds, and what engineers can change.
A driver and a pedestrian can make the same mistake at the same moment: one misjudges a gap, the other steps out a beat too early. Only one of them has a steel frame, airbags and a seat belt. The other has skin. That asymmetry is why traffic engineers increasingly treat the street itself as the safety equipment for people on foot and on bikes.
The toll is large. NHTSA counted 7,080 pedestrians and 1,103 cyclists killed in U.S. traffic crashes in 2024.12 The Safe System Approach adopted by the U.S. Department of Transportation starts from the premise behind that asymmetry: “Human bodies have physical limits for tolerating crash forces before death or serious injury occurs.”3 Three features of the road decide how often those limits are tested.
Speed sets the stakes
The physics is unforgiving. A moving vehicle’s kinetic energy rises with the square of its speed, so a car at 40 mph carries four times the energy of the same car at 20 mph. When a car strikes a person, the body absorbs much of that energy.
Speed also shrinks the chance to avoid a crash at all. At 30 mph a car covers 44 feet every second; at 45 mph, 66 feet. Distance covered while the driver is still reacting grows in step with speed, and braking distance grows with its square. A driver who would stop short of a crosswalk at one speed may still be traveling fast when reaching it at a higher one.
How sharply the risk climbs has been measured. A 2011 AAA Foundation for Traffic Safety study by Brian Tefft used federal data on U.S. crashes from 1994 to 1998 in which a pedestrian was struck by a forward-moving car, light truck, van or SUV, adjusted to represent pedestrians struck in 2007 to 2009. It estimated that a struck pedestrian’s average risk of death reaches 10 percent at an impact speed of 23 mph, 25 percent at 32 mph, 50 percent at 42 mph, 75 percent at 50 mph and 90 percent at 58 mph.14 The average risk of severe injury reaches 50 percent at 31 mph. Older pedestrians face much higher risk at any given speed.14 These are impact speeds, which can be well below the speed a car was traveling before the driver braked. A street designed for higher speeds asks the human body to absorb forces it was not built for.
Wide roads and long crossings
Most pedestrian deaths happen away from intersections. In 2024, 73 percent of pedestrian fatalities occurred at locations that were not intersections, and 84 percent occurred in urban areas.1 For cyclists, 30 percent of 2024 deaths occurred at intersections, and 81 percent were in urban areas.2
The multilane arterial, a wide road with four or more travel lanes, commercial driveways and signals spaced far apart, concentrates several risks. Speeds are higher. The walk to a signalized crossing can be long, so people cross where they are. Each extra lane adds time in the road and another stream of traffic to judge.
Width also creates a specific hazard. FHWA’s crash-type manual describes the “multiple threat” crash, in which a pedestrian entering the road at midblock in front of stopped or standing traffic is struck.4 On a road with more than one lane in each direction, a vehicle stopped in one lane can hide the pedestrian from a driver approaching in the next.
Darkness
Most pedestrian and cyclist deaths happen after dark. In 2024, 76 percent of pedestrian fatalities occurred in the dark, compared with 20 percent in daylight and 2 percent each at dawn and dusk.1 For cyclists, 52 percent died in darkness and 44 percent in daylight.2
FHWA frames the broader nighttime picture this way: fatal crashes in daylight and in darkness are about equal in number, but “only 25 percent of vehicle miles traveled (VMT) occur at night,” and the nighttime fatality rate is three times the daytime rate.5 At night, drivers have less time to see a pedestrian. Darkness also overlaps with other risks, such as fatigue and impairment, that these counts do not separate out.
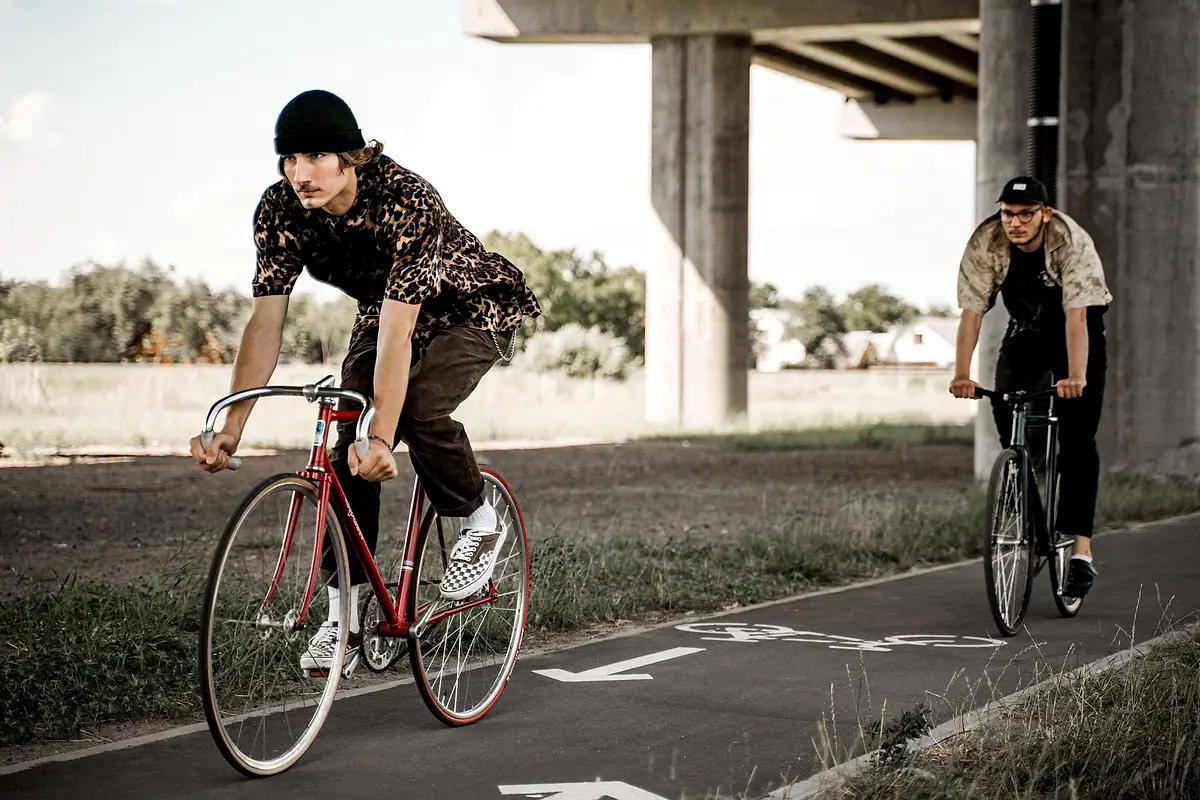
The engineer’s menu
The Federal Highway Administration maintains a list of Proven Safety Countermeasures, which it describes as “a collection of countermeasures and strategies effective in reducing roadway fatalities and serious injuries.”6 State and local agencies use it as a menu when they plan projects. Several items target the risks above.
Leading pedestrian intervals. The walk signal comes on 3 to 7 seconds before drivers get a green.7 Pedestrians step into the crosswalk first, where turning drivers are more likely to see them. FHWA says it lets pedestrians “better establish their presence in the crosswalk before vehicles have priority to turn right or left.”7
Medians and pedestrian refuge islands. A raised island in the middle of the road lets people cross one direction of traffic at a time.8 On a wide arterial, that turns one long, exposed crossing into two shorter ones.
Pedestrian hybrid beacons. These signals stay dark until a pedestrian pushes the button, then run a yellow-to-red sequence that stops traffic for the crossing. FHWA calls them “very effective at locations where three or more lanes will be crossed.”9
Rectangular rapid flashing beacons. Pedestrian-activated lights mounted with the crossing sign at uncontrolled, marked crosswalks. When activated, they “flash with an alternating high frequency” to catch drivers’ attention.10
Lighting. FHWA lists lighting as a crosscutting countermeasure, aimed squarely at the nighttime risk described above.5
Road diets. A road diet typically converts a four-lane undivided road into two through lanes and a center two-way left-turn lane. FHWA’s guidance lists “fewer lanes for pedestrians to cross” and room for refuge islands and bike lanes among the benefits.11
How this fits the Safe System Approach
Each of these tools follows the same reasoning. Instead of relying on every driver and every pedestrian to be perfect, it builds in a margin. A refuge island leaves room for a pedestrian who misjudged the far lanes. A leading interval gives a turning driver who was not looking closely an earlier, clearer view. Lower speeds give everyone more time and leave less energy to absorb when things still go wrong.
That is the Safe System Approach in practical form. USDOT’s version accepts that “people will inevitably make mistakes” and calls for road environments designed “to mitigate human mistakes and account for injury tolerances.”3 Its Safer Speeds objective calls for “context-appropriate roadway design” and “appropriate speed-limit setting.”3
The approach also reframes a familiar statistic. NHTSA’s often-quoted finding that the “critical reason” was assigned to a driver in about 94 percent of sampled crashes is sometimes read as a reason to focus only on drivers. The Safe System view reads the same fact the other way: if mistakes are constant, the road has to absorb them. Our explainer on what share of crashes involve human error traces that argument from the original data.